Yes Bank Stock Analysis
The stock of Yes Bank Ltd. is currently faring
better than the previous year at a price of INR 23 but it’s is nothing compared
to the performance of the stock when the price of stock hovered near about INR 300
levels during its meteoric rise in 2018-19 after which it was hit by various
scandals perpetrated by its founder Rana Kapoor. In an RBI report it was
alleged that Rana Kapoor along with other management staff was involved in
siphoning of funds to certain companies and hiding actual loses from the eyes
of the public which amounted to around 3,277 crores along with lending loans to
a number of financially stressed companies like Jet airways, CCD, Essar and so
on. s
But recently the bank’s metrics have been
improving with Liquidity to coverage ratio falling from 118 in previous quarter
to 116 in the present quarter of 2024 mainly driven by growing deposits and
lower credit costs. The bank has been introducing new concepts to induce
organic growth, the following two are the main concepts
·
Spectrum
banking: It is basically online banking services offered with extra layers of
encryptions and security
·
Cluster
banking: Offering lending services to a well-defined cluster of MSE in certain
regions. The bank started such initiative in the districts of Ujjain and Nashik
by opening more branches, more ATMs and business correspondent banking centers.
New initiatives such as Yes private program and
Yes First for UHNI customers will help the bank in gaining larger share of
these individuals by offering curated services catering to requirements of
their business or wealth management, under the “Yes Private Programme” 1,500
customers have been enrolled putting money worth around 3,400 crore rupees.

All of the above schemes increased the bank’s
current quarter 2024 Net Profit has to rupees 231 crore as compared to rupees
51 crore in the same quarter’s earnings in 2023. Recently the Carlyle Group
sold 39 crore shares of Yes bank worth rupees 1,056 crore which were then
bought by Morgan Stanley Asia. Currently
the bank is looking for a new promoter to sell around 51% stake in the company
for a valuation of around which is supposed to increase the share price.
The bank is
implementing certain strategic business objectives which are described in boxes
below:

The bank has been active in mitigating the
climate risks by funding environment friendly business. It doubled the EV based
assets to INR 120.41 crores and offered financing solutions worth INR 1,482
crores to renewable energy plants in India. Yes, Bank is the only Indian bank
to be a part of UNEP’s committee responsible for managing the “Principles for
Responsible Banking and Collective Commitment to Climate Action” and recently
the bank was awarded an A-rating by Carbon Disclosure Project for its 2022 Climate
Change Disclosures.
The bank has been an active player in promoting
financial inclusion by establishing divisions like Inclusive and Social Banking
along with Microfinance banking. Through its network of AePS and micro- ATMs
the bank plays a vital role in sending remittances to rustic regions of India.
YES LEAP, the bank’s group lending program offers financial services to SHGs,
JLGs, and microfinance institutions. The rural portfolio is spread over 225
districts with total advances of around INR 4,836 crores and conducting around
1,798 financial literacy camps in rural areas.
ANALYSIS
Moving Average Convergence and Divergence
Oscillator:
MACD is a trend following momentum which tries to
explain the relationship between 12 days and 26 days Exponential Moving Average
(EMAs) to measure the trends in price movements to identify the market entry
points.


When the distance between MACD and Signal lines increases there is a strong momentum in the stock. The MACD crossover can give an early sign of a reversal. Since we can see that the MACD line is same as the signal line which indicates that there is neither bullish nor bearish perspective among the stock brokers. But we can see that the MACD line is always near the zero line after 2019 which means there is a chance that the price may bounce back in future which is known as Zero-line Pullback.
COMPARISON

The above graph shows that the bank has to
cover a lot of ground in terms of its stock price when compared to IndusInd
Bank’s stock price which is one of the top 10 banks in India with 2,606
branches offering services to around 34 million customers. But as per the MACD
indicator there is a chance that the price of yes bank stock may increase in
future whose potential can be very much high offering larger gains.
RSI is a measure of stock momentum by
describing the speed and size of price changes. This information can be used to
determine whether the stocks are overbought or oversold, according to which
investors can decide to exit the stock. So, I have calculated RSI for Yes bank
and IndusInd bank on the basis of 14 days to compare whether we should exit
from Yes Bank or not. RSI Index is also calculated to determine whether a stock
is supposed to enter a trend reversal or corrective pullback in future. An RSI
index above 70 level may indicate over enthusiasm regarding the stock among
investors which pulls the price of the stock to meteoric levels.
The following is the formulae for RSI Index:

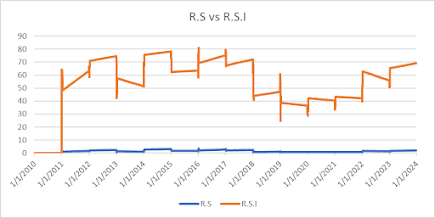
Since the RSI of yes bank is near about 70 level indicating that the stock might turn out to be overbought soon, investors need to be cautious to determine when to exit the stock if it cross level 70 and then falls below this level. Also, the RS line shows that there is very few possibilities for the stock to rise in the future but given the stable nature of yes bank’s business along with future diversification possibilities into new areas the stock can be of very high potential.
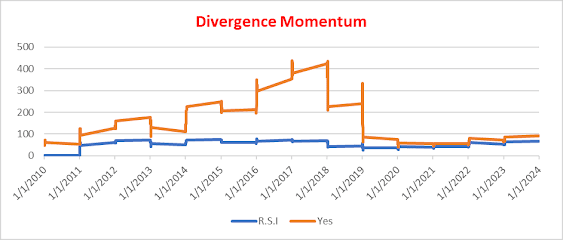
From the above graph we can see that there was high divergence between RSI and price of stock for yes bank during 2019-20 when it was being probed by authorities for being engaged in illegal activiities but at present the divergence has been less impying that higher highs in yes bank stock price and lower highs in RSI, which means that there is a possiblity of uptrend in stock price.
But when we see the same graph for IndusInd bank we can see no divergence indicating more stability in the price of the stock. Here the RSI is having higher highs and price having lower highs indicating higher chances of increase in price of the stock as compared to the price of Yes bank stock.

VALUE AT
RISK
VAR (Value At Risk) is a statistical measure that
gives us the maximum amount of loss that can occur for a given period of
holding for a certain level of confidence level. I have calculated VAR using
the historical method which uses returns belonging to the lowest quintile of
the price distribution defined by the confidence interval.
From the comaprison below we can conclude the
following :
A 5% VAR of 18.86% for Yes Bank Ltd. Means that there
is a 95% confidence that the stock will not have a loss higher than 18.86% on a given day where as the VAR for Induslnd
bank at 5% level is 14.47% indicating that loss is limited as comapred to the
Yes bank stock price. Since VAR doesn’t give any information about a potential
loss higher than VAR itself it can be used to predict future losses.
But given the comparison between Yes bank and IndusInd bank stocks we can see that as per VAR Yes bank always have a higher percentage of loss for all the confidence interval.

|
Confidence Levels |
90% |
95% |
99% |
|
VAR |
.188269 |
.221144 |
.366134 |

|
Confidence Levels |
90% |
95% |
99% |
|
VAR |
.144735 |
.205132 |
.319912 |
TREND ANALYSIS
Trend analysis is a kind of analytical method used to
forecast some kind of pattern in a set of data. Through this market trend
analysis I have ploted four graphs below to predict the movement of stock
prices of four Indian banks.
A basic trend model tells us the predicted value for
the dependent variable over a specified time period. In the present case I have
used a liner-log model given as follows:
Yt = a +
log(t) + et
Yt : is the predicted value for the EPS of
the stock
Log(t) : log of the time period
et : is the error term
I have collected data on earnings per share of the
above mentioned banks for 18 years on a quaterly basis and decided to run a
trend analysis on this historical data. Since EPS tell us about the future
profitablity of a firm as it is calculated by dividing the net income by total
number of comman shares. So an uptrend in EPS would surely signal that the
enterprise is going to be profitable in the future as a higher EPS means that
the company can provide a higher payout to the shareholders.
From the following comparison we can conclude that:
·
For
Yes bank we can see that the EPS trend line is expected to fall in the future
even though at current it is hovering at rational levels.
·
IndusInd
and Axis Bank EPS trend lines are expected to rise meaning these two stocks can
be profitable in future as comapred to owing shares of Yes Bank Ltd.

The above figure tells that over a relative time period the EPS of Axis bank would increase by 63.19% with a goodness of fit given by 16.16% whereas for Yes Bank for one unit increase in the relative time period Yes Bank EPS is predicted to fall by 41.73% but the goodness of fit is very small around 2.7%. Because a small goodness of fit means that the model is a poor predictor of the data and is bound to give a spurious results. But still we can focus on the trend of EPS in the Yes Bank shares which shows a downward trend, hence investors need to be cautious whether to decide to buy shares or not.


The model for IndusInd bank predict a better result with a one unit increase in time period the EPS of the stock increases by 183.73% along with an upward trend.

Yes bank is
closely related to the performance for Canara bank with a similar downtrend so
it won’t be advisable to make a portfolio consisting of only these two bank
stocks.
I have used
the famous Benjamin Graham formula to predict the expected growth value of the
stocks over 2 years, which by following:
V* = EPS x (8.5 + 2g)
EPS: means
the earnings per share of the company
g: means
the expected growth rate in price of the firm
8.5 is the
usual price earnings ratio for a no growth mid-cap firm usually referred to as
the Graham number used by a lot of analysts and made popular in his famous book
“The Intelligent Investor”
So when we
applied the above formula to get a expected growth rate for 2 years we found
that yes bank stock is expected to fall by 12.52% whereas the IndusInd bank is
expected to rise by 140.23 % but as said by Benjamin Graham himself there is no
perfect science to predict the valuation of a stock, the fellow investor can
decide to buy Yes Bank stock at cheap and decide to hold it for long term.
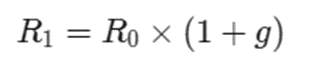
R1:
current stock price
R0:
post stock price
g: average
growth rate of the stock price
Since the basic principle of forecasting
requires that forecast should be less variable than the variable forecasted
because if the forecasting is highly volatile, we can’t see the existence of a
trend which means that the stock prices aren’t reflecting any information
related to future prospects, dividend payouts, cashflow positions, etc.
We can conclude from the following diagrams
that the yes bank stock is expected to show an uptrend in the future whereas
the stock of IndusInd bank is showing a flat forecasting line meaning not much
potential gain.


Comments
Post a Comment